利用 Grafana 监控 RouterOS 运行状态

乱翻收藏夹的时候发现我还有个免费的 Grafana Cloud,遂想着把我这些自建的东西都用它监控起来,反正不用白不用。那么第一个就拿我的 RouterOS 软路由开刀吧。

环境

  • Mikrotik CHR 7.12
  • Grafana Cloud - Cloud Free 订阅
  • Prometheus 2.37
  • mktxp
  • CloudFlare Tunnel,如果你像我一样把 Prometheus 部署在家宽的话

在 RouterOS 系统创建组和用户

毕竟还是用第三方工具登陆路由器,还是遵循最小权限原则,给 mktxp 创建一个只包含必要的权限的账号比较好。

1
2
/user/group add name=prometheus policy=read,api
/user add name=prometheus group=prometheus password=changeme disabled=no

配置 mktxp

mktxp是一个面向 Mikrotik RouterOS 的 Prometheus exporter。选择这个而不是 nshttpd/mikrotik-exporter 主要出于以下两个原因:
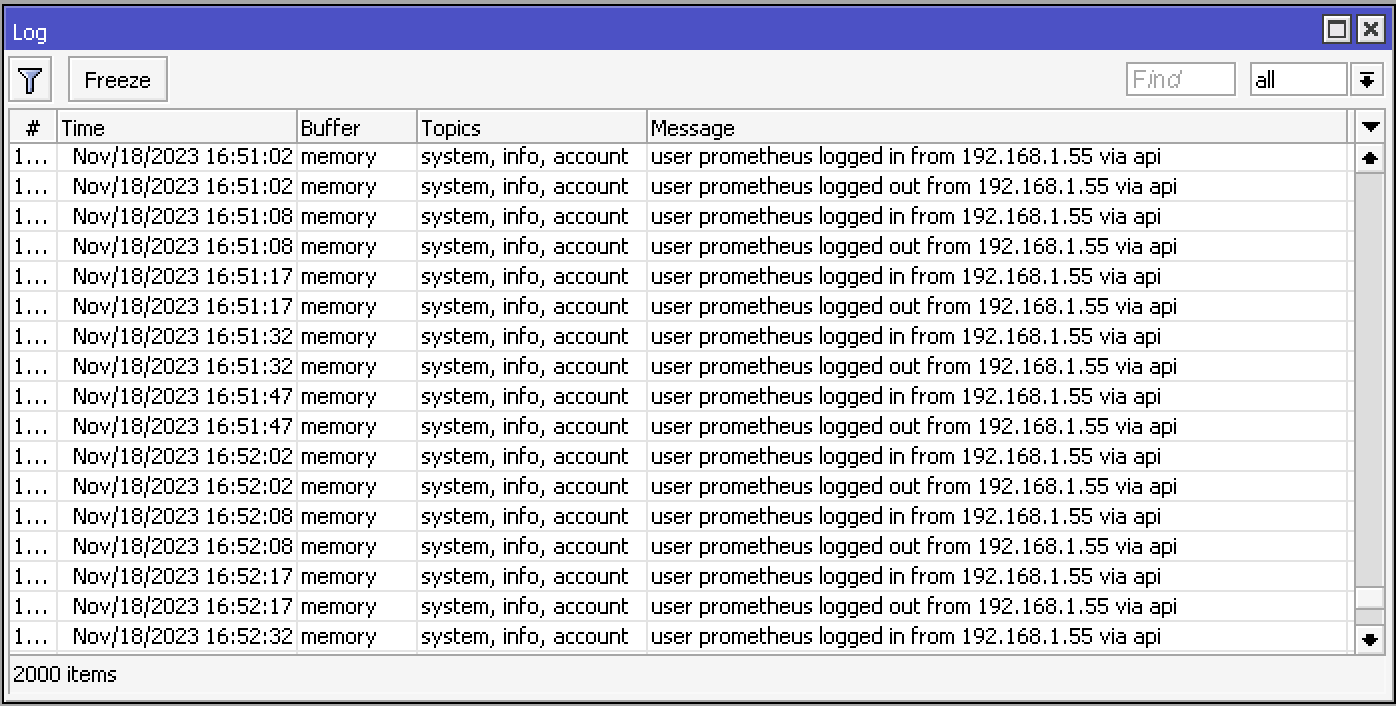
  • nshttpd/mikrotik-exporter 已经停止更新,最后一次 commit 停留于 2022 年 6 月 17 日
  • 它每一次获取数据都会登入和登出,而这会导致 RouterOS 的日志里面充斥 prometheus 用户的登入和登出记录,就像这样:

我使用 Docker 部署 mktxp,它需要两个配置文件:mktxp.conf_mktxp.conf

_mktxp.conf 负责 mktxp 的运行配置,比如端口号、数据获取的间隔时间等。内容如下:

1
2
3
4
5
6
7
8
9
10
11
12
13
14
15
16
17
18
19
[MKTXP]
port = 49090
socket_timeout = 2

initial_delay_on_failure = 120
max_delay_on_failure = 900
delay_inc_div = 5

bandwidth = True # Turns metrics bandwidth metrics collection on / off
bandwidth_test_interval = 420 # Interval for colllecting bandwidth metrics
minimal_collect_interval = 5 # Minimal metric collection interval

verbose_mode = False # Set it on for troubleshooting

fetch_routers_in_parallel = False # Set to True if you want to fetch multiple routers parallel
max_worker_threads = 5 # Max number of worker threads that can fetch routers. Meaningless if fetch_routers_in_parallel is set to False

max_scrape_duration = 10 # Max duration of individual routers' metrics collection
total_max_scrape_duration = 30 # Max overall duration of all metrics collection

mktxp.conf 用于配置要监控的 RouterOS 实例,内容如下:

1
2
3
4
5
6
7
8
9
10
11
12
13
14
15
16
17
18
19
20
21
22
23
24
25
26
27
28
29
30
31
32
33
34
35
36
37
38
39
40
41
42
43
44
45
46
47
48
49
50
51
52
53
# Router为路由器的代号,可以改成自己喜欢的值
# 将来在Grafana就是用这个来区分各个RouterOS设备
[Router]
# 是否启用对这个RouterOS设备的监控
enabled = True

# 路由器的地址
hostname = 192.168.1.1
# RouterOS API服务的端口
port = 8728

# 填写上面创建的 prometheus 用户的账号和密码
username = prometheus
password = changeme

# SSL部分关闭就行
use_ssl = False # enables connection via API-SSL servis
no_ssl_certificate = False # enables API_SSL connect without router SSL certificate
ssl_certificate_verify = False # turns SSL certificate verification on / off

# 以下为各个监控的开关,按需设定即可
installed_packages = True # Installed packages
dhcp = True # DHCP general metrics
dhcp_lease = True # DHCP lease metrics

connections = True # IP connections metrics
connection_stats = False # Open IP connections metrics

pool = True # Pool metrics
interface = True # Interfaces traffic metrics

firewall = True # IPv4 Firewall rules traffic metrics
ipv6_firewall = False # IPv6 Firewall rules traffic metrics
ipv6_neighbor = False # Reachable IPv6 Neighbors

poe = False # POE metrics
monitor = True # Interface monitor metrics
netwatch = True # Netwatch metrics
public_ip = True # Public IP metrics
route = True # Routes metrics
wireless = False # WLAN general metrics
wireless_clients = False # WLAN clients metrics
capsman = False # CAPsMAN general metrics
capsman_clients = False # CAPsMAN clients metrics

user = True # Active Users metrics
queue = True # Queues metrics

remote_dhcp_entry = None # An MKTXP entry for remote DHCP info resolution (capsman/wireless)

use_comments_over_names = True # when available, forces using comments over the interfaces names

check_for_updates = False # check for available ROS updates

然后用如下 docker-compose.yml 启动 mktxp 即可:

1
2
3
4
5
6
7
8
9
10
11
12
13
14
---
version: '3'

services:
mktxp:
image: ghcr.io/akpw/mktxp:latest
container_name: mktxp
restart: always
environment:
- TZ=Asia/Shanghai
ports:
- 49090:49090
volumes:
- <存放以上两个conf的目录>:/home/mktxp/mktxp/

mktxp 在启动成功的情况下是没有日志输出的,访问 49090 端口(即_mktxp.conf 中配置的端口),如果能看到一大片 Prometheus 的 metrics,那就说明启动成功了。

配置 Prometheus

prometheus.yml 中添加如下配置:

1
2
3
4
5
6
7
8
scrape_configs:
- job_name: 'mikrotik_exporter'
static_configs:
- targets: ['mktxp的主机地址:49090']
# 标签按需,不想要可以去掉
labels:
instance: 'CHR'
environment: 'Production'

重启 Prometheus,然后到 Prometheus 的 Status -> Targets 中,检查 mikrotik_exporter 这个 target 是否存在,以及 State 是不是 UP

配置 Grafana

如果你的 Prometheus 是部署在家宽环境,那在配置 Grafana 之前需要先做个内网穿透,让 Prometheus 的 9090/tcp 端口能被外网访问到。内网穿透的方案有很多,比如我就用的 CloudFlare Tunnel。因为本文不是讲内网穿透,所以就不展开讲配置了。

到 Grafana 的 Home -> Connections -> Data sources 中,添加一个新的 Prometheus 数据源,其中 Prometheus server URL 填你的 Prometheus 服务的地址,别的不用管,Save & test 成功就没问题。
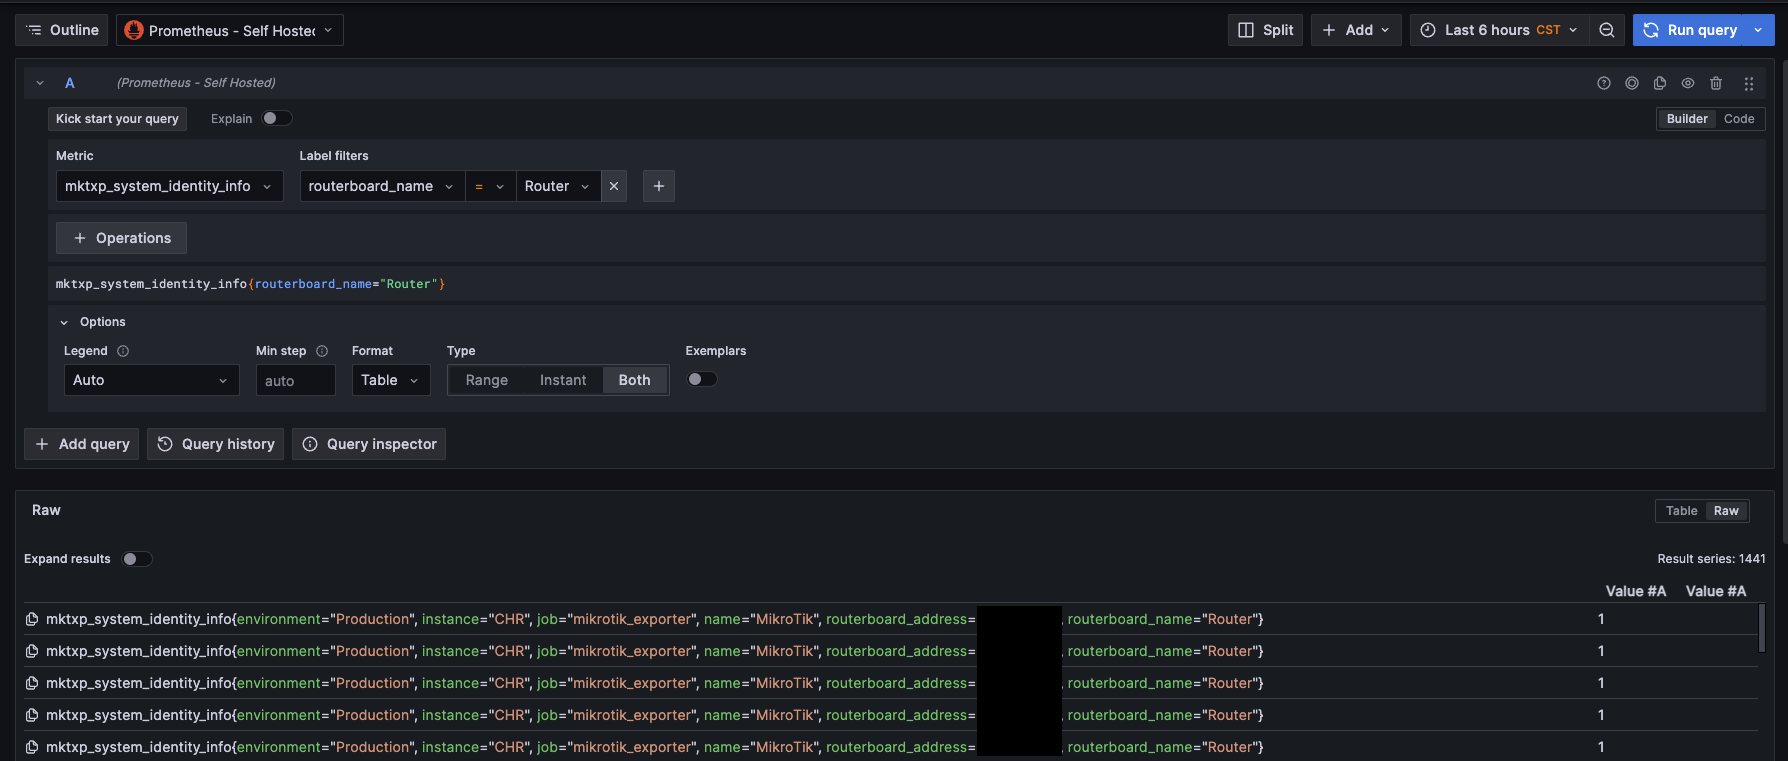
此外,还可以到 Grafana 的 Explore 页面查询一个 mktxp 的 metrics,来检查 Grafana 是否能成功获取到数据。
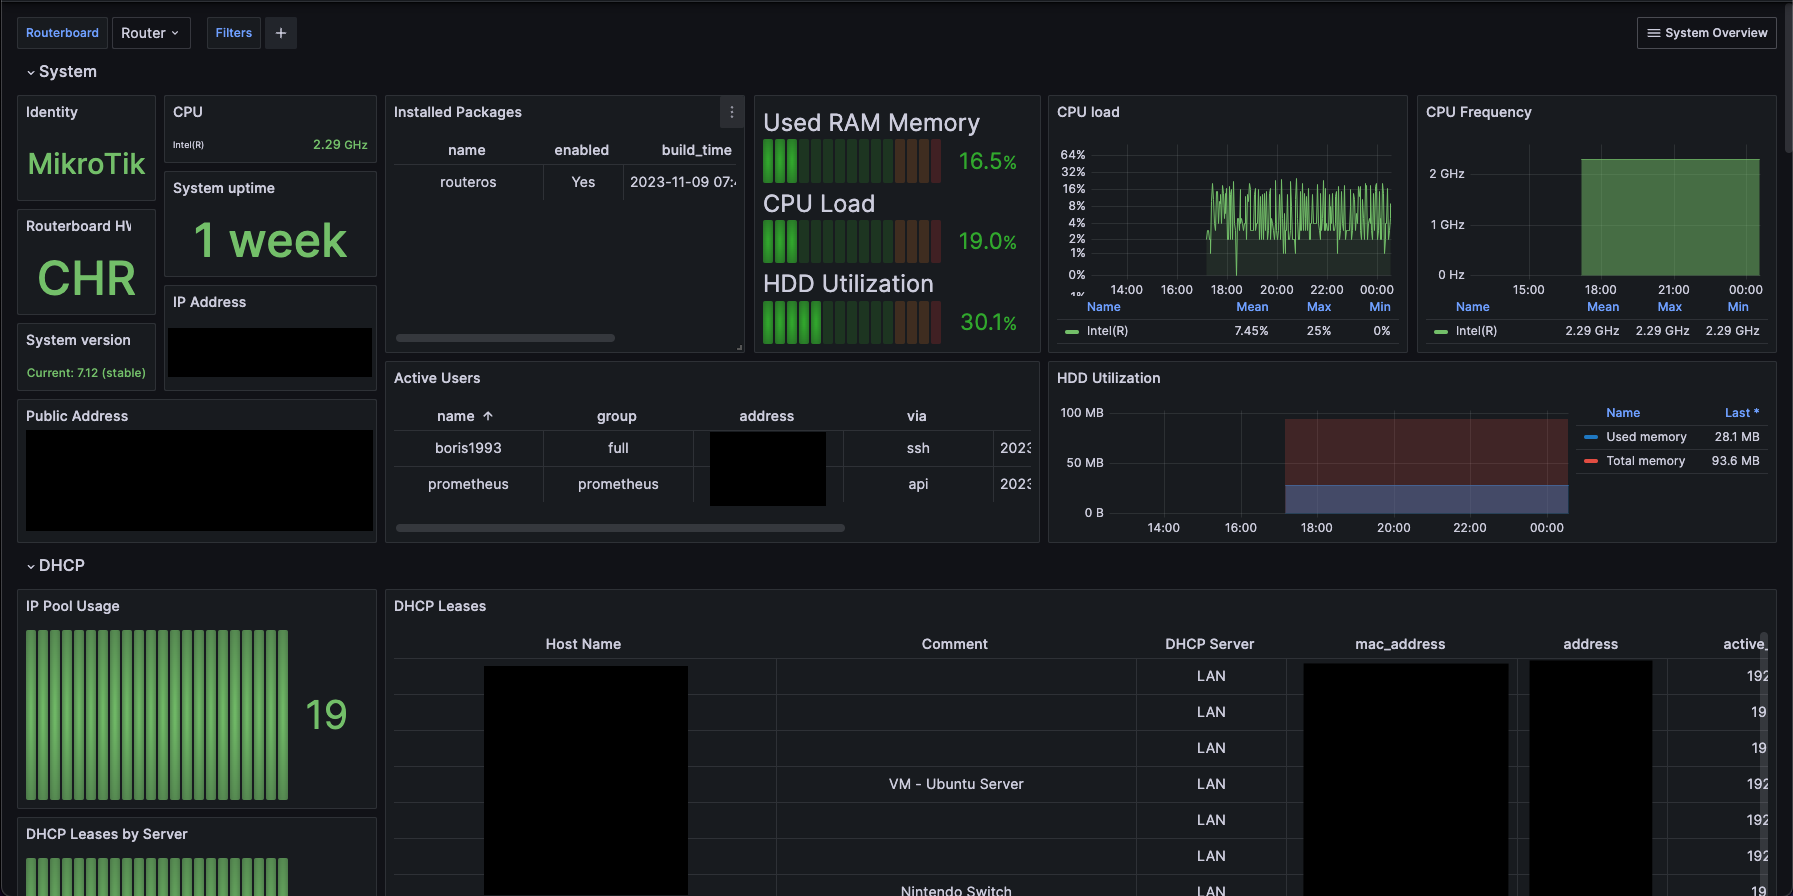
确认 Grafana 能成功获取到数据后,就可以导入 mktxp Grafana Dashboard了。到 Grafana 的 Dashboards 页面,点击 New 按钮后选择 Import,填写这个 dashboard 的 ID13679,点 Load,在下一个页面给这个 dashboard 绑定我们的 Prometheus,然后点 Import,就可以用了。